We’re excited to announce the new changes to DermEngine’s Clinic Analytics and Clinics Dashboard. The new layout has been created to be a user-friendly and intuitive way for you to view your analytics in one convenient location. With the new design, you’ll be able to clearly view all relevant data and manage your practice with ease.
Clinic Analytics
You’ll notice quite a few changes to DermEngine's layout: across the top of your page will be your number of Doctors, Patients, Diagnoses and Plan Usage. Below that, there are new graphs which display the clinic’s number of patients, images and diagnoses. Each of these graphs can be customized to show information from the past 7, 14, 28, or 90 days or monthly depending on your preference. Below, there are pie charts to show data about the types of actions performed and top diagnoses.

.png?width=675&name=clinic%20analytics%20drop%20doctor%20with%20arrows%20(1).png "clinic analytics doctors .png")
Enterprise Dashboard
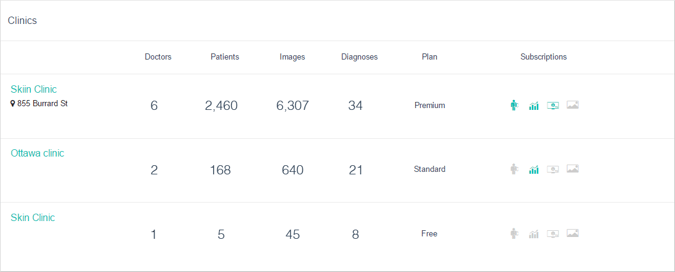
In the Clinics Dashboard (for Enterprise accounts), there are also some exciting changes. Across the top information bar, the number of Clinics has been added for your convenience. Below, the bar graphs have changed to a line graph with the option of showing Image, Patient, Diagnoses, or Doctor statistics over time or as a cumulative result.

Topics: DermEngine Dermoscopy Clinic Clinic Management Clinic Dashbaord Artificial Intelligence Teledermoscopy EMR Solutions News & Events
Register for a Free Online Demo
Curious about how DermEngine can benefit your practice?

Talk to a product specialist and have all your questions answered.